
In a previous project, the Tone-caster, I was able to build a tone control which when turned one way cut the treble and when turned the other way, cut the bass. This was an interesting project and the bass cut control is actually pretty useful in creating interesting tones. It cleans up muddy humbucker sounds, for example.
When I first started working on that project, I tried to calculate the values I would need for the various passive components: the treble capacitor and the bass resistor and capacitor. I used the standard EE formulas for low and high pass filters but when I did the calculations, using values similar to those typically used in guitar treble controls, I found the results made no sense. I saw things like the treble cut would filter out frequencies higher than 29 Hz, which is clearly absurd – most people can’t hear anything below 30Hz. So I started to read more about how pickups really worked. There is quite a bit out there, both nonsense and fact, and I found out that I had many misconceptions. Dr. Lawing’s blog is a fun place to start. Helmuth Lemme is another good source for the basics.
One of the things I learned is that pickups are best thought of as parallel RLC circuits (a resistor, an inductor, and a capacitor wired in parallel) and consequently the tone controls in the guitar are not simple low or high pass filters. They are part of a much more complicated circuit, which, truth be told, I was unable to analyze mathematically. So I decided I would try to understand pickups and tone controls through empiricism and measurement, instead of through analysis. I decided to build a test system which I would use to measure a pickup’s output dynamically. But I wanted to be able to look at the output after it passed through the various circuits in the guitar so I could see how the tone circuitry affected the signal. This part seemed critical once I realized the guitar tone circuitry could affect the signal in ways I had not previously understood.
This write-up describes how I went about characterizing a couple of different pickups, providing breadcrumbs in case anyone else is interested in doing something similar.
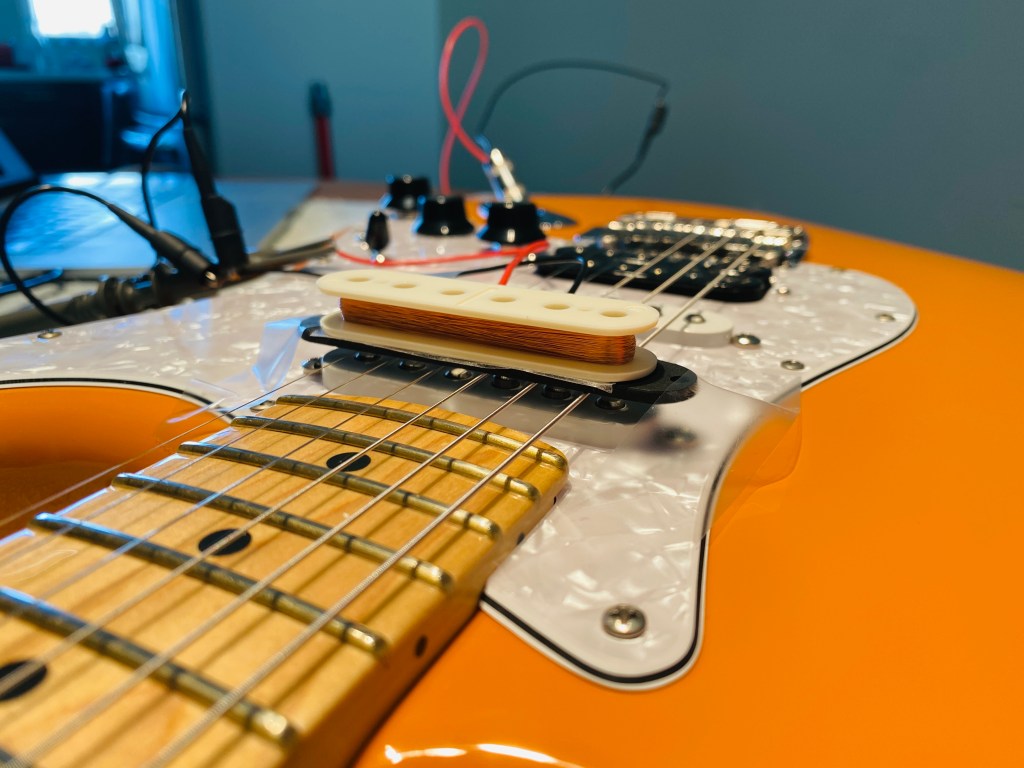
The first thing I did was to build the system I would test. To do this I built an inexpensive Stratocaster clone from random parts I found for sale online. I bought a used tangerine body, a used Fender neck, and a used Fender 2 point tremolo bridge. Warmoth supplied a custom designed pickguard and I bought the pickups from DiMarzio and from Seymour Duncan. The engraved knobs are from Philadelphia Luthier Tools.
To study different types of pickups, I used DiMarzio noiseless single coils in the neck and middle position (Area 58 in the neck and Area 67 in the mid) and a Seymour Duncan JB trembucker in the bridge position. These are not balanced pickups, the JB is much hotter than the DiMarzio pickups but I wanted extremes, both in output and in frequency response. Note: A trembucker is simply a humbucker but with slightly altered magnet pole spacings to fit into a slightly wider string-to-string spacing, like a Stratocaster bridge 😉
Here is the test system I built.


Incidentally, there is a reason I always use Schaller locking tuners in my from-scratch builds. On this guitar, the Fender neck was already pre-drilled for Fender branded tuners, which have a different mounting system than the Schaller tuners I have in stock, so I went with the Fender versions. Check out the tuner for the ‘A’ string in the photo below. Yes, the locking part of that tuner was defective, which sadly has been my experience with too many Fender parts (and entire guitars).

Also non-standard were the tone controls. I crafted the same treble and bass cut circuits which I first prototyped in the Tonecaster project. Here was my wiring diagram for the stratocaster test system. The capacitor values were determined empirically in a previous project, retrofitting the Psychadelicaster to incorporate a bass control.

With step 1 finished, and the guitar ready for testing, it was time to figure out what came next.
I built a simple test jig, consisting of a Stratocaster pickup bobbin (with no pole pieces) wrapped in 220 turns of #42 gauge, enamel insulated wire. With an air core and a small number of coils, the test jig ought to have a very low inductance and my hope was it would not affect my measurements of the system under test in any significant way. The plan was to send an AC signal through this test jig, which would in turn produce a signal in the pickup I would be measuring.

This test jig would accept a sine wave, a pure tone at a specific frequency, and, because any alternating current running through through a coil of wire produces an alternating magnetic field, this would simulate the guitar strings, generating an alternating magnetic field which the guitar pickup would see and would turn into a voltage, which I would then measure. But this plan meant that I needed a signal generator of some kind, to create the input sine wave.
Another question was how to measure the pickup. It is one thing to generate a sine wave but what I really wanted was a system which could generate a sine wave at a specific frequency, measure the voltage output of the pickup, then increase the frequency and repeat the same procedure, sweeping from about 20Hz to 20 KHz (the standard audio frequency range). There is a name for this kind of test setup, it’s called a frequency response analyzer. Sometimes it is also referred to as a network analyzer. Typically, devices that perform this function are extremely expensive.
After a bunch of research, I stumbled on the Diligent Analog Discovery 2, an amazing USB oscilloscope which offered everything I needed: a signal/waveform generator, an oscilloscope, a network analyzer, and the ability to interface with a Macbook. This was the only device I could find which met all my criteria, especially MacOS compatibility and cost under $400.
OK, ready, set, go!
Before moving on to the testing, I want to mention a couple of things I learned about pickups, which informed what I planned to measure. I mentioned earlier that pickups can be thought of as parallel RLC circuits. Parallel RLC circuits, when operating, have a natural ‘resonant frequency’. What this means for a pickup is that at this frequency, the pickup will output its highest voltage, its strongest signal. This seems like a useful way of characterizing a pickup’s sound and I hope to correlate this with the pickup’s inductance and it’s overall sonic character.
It is often claimed that humans can hear frequencies between 20 Hz and 20 KHz but in fact humans are most sensitive to frequencies in the 2 Khz – 5 Khz range. Lower and higher frequencies “fill out” the sound but the core of what we hear is found in this narrow range.
A pickup’s resonant frequency is influenced by the pickup’s inductance and its capacitance. Inductance is influenced by the type of core in the inductor (the type of pole pieces) and by the number of coils of wire wrapped around the core (resistance). For a given pickup with a given core type, increasing the number of coils of wire in a pickup will increase its inductance and its output. The type of wire used affects the overall resistance and also the pickup’s capacitance. Thicker wire obviously has less resistance but takes up more space, reducing the number of coils so it’s all a trade-off.
As the inductance increases, the resonant peak decreases and the strength of the output signal increases. So you can see why pickups will sound different from each other. Hotter pickups tend to have an increased number of coil windings and so they will have higher inductances and therefore a lower resonant frequency (less treble, more midrange and bass). They will also produce more voltage. So they will sound louder but their high end will be reduced.
Incidentally, this is why humbuckers sound ‘darker’ and can occasionally sound ‘muddier’ than single coil pickups. They typically have higher inductances, essentially acting like two single coil pickups in series, doubling the inductance. Higher inductance = lower resonant frequency and higher output.
So the first thing I did was to measure (using my LCR meter) the inductance (out of the circuit) and the DC resistance of each of the pickups.

| Brand | Model | Style | magnet type | Inductance | DC Resistance | Advertised resistance |
| DiMarzio | Area 58 | noiseless single coil | Alnico 2 | 2.71 H | 6.3 K ohm | 6.15 K ohm |
| DiMarzio | Area 67 | noiseless single coil | Alnico 2 | 2.73 H | 6.1 K ohm | 5.85 K ohm |
| Seymour Duncan | JB | trembucker / humbucker | Alnico 5 | 8.73 H | 18.2 K ohm | 16.6 K ohm |
Based on these measurements, one can see the single coils are likely to sound very different from the SD JB trembucker. It’s also the case that the DiMarzio single coils are basically the same product, with two different names. Noticing the JB DC resistance measured significantly higher than advertised, I also measured it using a standard multimeter and confirmed the 18K Ohm value.
The next step was to see how the pickups performed in the guitar under test. Here are some photos of the system under test – click on the pictures for large versions. Here I connected the signal generator and channel 1 of the scope to the test jig and I connected channel 2 of the scope to the output jack of the guitar. The Analog Discovery 2 will calculate a differential between the two channels while also sweeping the frequency from 20 Hz to 20 Khz. In all graphs, yellow is channel 1, blue is channel 2.


Ultimately, I ended up using the test jig rotated 90 degrees relative to the pickup. The reason is that with humbuckers, the pole pieces on each side of the humbucker use a magnetic polarity which is reversed, relative to the other. Therefore the input test jig needs to ensure the magnetic polarity it generates accounts for the differing magnetic polarities. By lying the test jig on its side, it will send the appropriate magnetic field polarity to each pole piece.
Here is the output from the DiMarzio Area 51 noiseless single coil. If you click on the image, you will then find a button which asks if you wish to view it in full size. Then you can see all the detail you wish.

In the above, the resonant frequency is measured at 5.02 KHz Now let’s compare to the Seymour Duncan JB.

The resonant frequency of the Seymour Duncan pickup is 2.76 KHz, substantially lower than the DiMarzio Area 58 pickup. As one would expect, this dramatic difference in resonance is very obvious when the guitar is played through an amplifier. The Seymour Duncan pickup sounds heavy, warm, full, but also lacking in what some people call ‘brilliance’. Played back to back against the DiMarzio pickups, it almost sounds muffled. The DiMarzio, in turn, sounds more bell-like, more brilliant, and with 500K volume and tone potentiometers, almost a little bit harsh. Certainly they sound more like a typical stratocaster. This difference in frequency response and audible response also tracks the difference in measured inductance of the two pickups.
Another interesting thing I learned while reading about magnetic fields is that the voltage amplitude in a coil is determined by the velocity of the conductor moving through the magnetic field but, further, it is the velocity perpendicular to the magnetic field’s lines of force which matters. What this means for an electric guitar is that the strings only produce a signal in the pickup for that part of their vibration which brings them closer to and further away from the pickup. Any side to side motion, relative to the pickup, is basically invisible to the pickup, and hence inaudible to our ears when amplified.
This is another reason electric guitars have their own sound.
Next I thought I would try to capture the effects of the bass and treble circuits and their effectiveness. All of the following snapshots were captured using the DiMarzio Area 58 pickup.
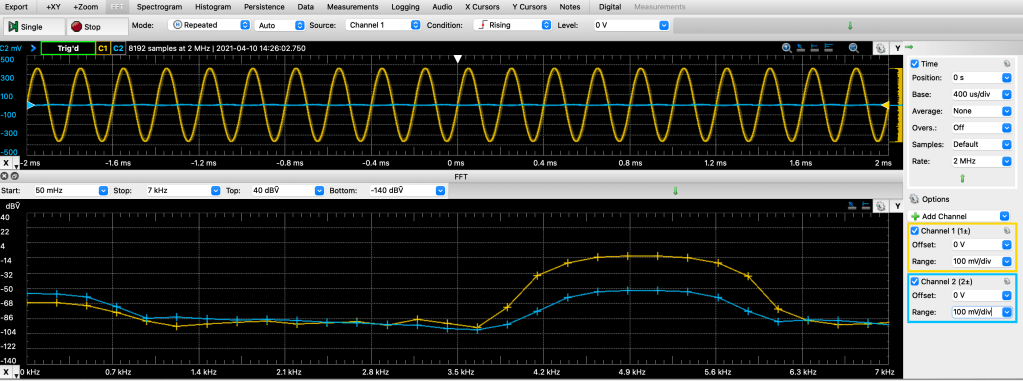
For this first test, I sent a sine wave into the test rig at a frequency of 400 Hz. In the image below there are three windows. The lowest window shows the sine wave being generated. The middle window is a frequency vs amplitude (FFT) graph of the output of the pickup seeing the 400 Hz input.
And the first window below graphs the input to the test jig (yellow) against the output of the pickup (blue) in an amplitude vs time graph. We see roughly a 50 mV swing in amplitude, peak to peak on channel 2. This is not very strong but that is because this is a low frequency input and the pickup’s resonant frequency is much higher.

Next, let’s turn the bass knob all the way down.
Here is the same view, with the same 400Hz input signal but with the bass turned off.

Notice the amplitude of the pickup output, the 400 Hz signal, is now 20 mV, peak to peak. This shows the bass cut effect is quite noticeable, even when the pickup’s output is not very strong because of the low frequency at which it is operating.
Now lets consider a high frequency input signal. Here is a graph of the response to a 5 KHz input signal. This input signal is very close to the resonant frequency of the pickup and we clearly see that in the output – channel 2 (blue) is showing approximately 900 mV peak to peak, far more output than when receiving a 400Hz signal. The FFT and input signal windows are included below.

The next trace shows the system with the treble cut fully instantiated – there is basically no 5KHz signal any longer! When looking at the FFT graph, you can see the amplitudes of the frequencies around 5KHz have been cut significantly when compared to the FFT graph above.
For my next steps, I will characterize a few more different pickups in guitars I have laying around. Eventually the goal is to describe a pickup sound using just the inductance and the resonant frequency graphs. I will try to determine whether I can find a mathematical correlation between a pickup’s inductance and its resonant frequency, using the various guitars I have lying around. Check back soon.
Categories: music
Tags: bass control, Diligent Analog Discovery 2, DiMarzio, frequency response analysis, inductance, LCR meter, network analyzer, parallel RLC, pickup analysis, resonant frequency, seymour duncan, stratocaster, trembucker

I appreciate your detailed explanation of how you built this test system.
LikeLike